 Skip to content

 Drivers all across the UK will know the problems that potholes are causing to our country’s road network, with this being an issue that just doesn’t seem to want to go away, and is continuing to cause headaches for motorists.
 Drivers all across the UK will know the problems that potholes are causing to our country’s road network, with this being an issue that just doesn’t seem to want to go away, and is continuing to cause headaches for motorists.
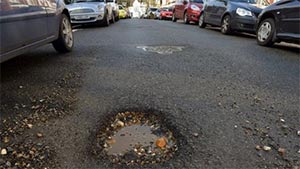
A new report from the RAC revealed that the organisation dealt with more than 6,500 breakdown jobs between January and March 2017, which were likely attributable to poor road surfaces. The last time that so many pothole-related breakdowns were recorded in a three-month period was in the first quarter of 2015 (almost 6,900 breakdowns were recorded then). However, in the early months of 2015, the country was subjected to more days of frost and rainfall when compared to the first three months of 2017, when the nation experienced mild and moderately dry conditions.
Autotech Recruit’s client, Inchcape Volkswagen, a VW service provider of aftersales services, MOTs and repairs to solve problems like suspension damage and wheel misalignment, attempts to find out just how bad has the UK’s road network become as a result of potholes.
Where are the UK pothole hotspots?
Gathering together the road hazards that have been reported to them, FillThatHole.org.uk has been successful in putting together a league table of the top ten locations for potholes. They rank as follows:
| Position | Authority | Region | Total reports | Open reports | Fixed reports | Percentage fixed |
| 1 | Surrey | South East England | 7,657 | 6,473 | 1,149 | 15% |
| 2 | Hampshire | South East England | 4,133 | 3,241 | 849 | 21% |
| 3 | Essex | South East England | 3,804 | 2,912 | 878 | 23% |
| 4 | Hertfordshire | South East England | 3,557 | 3,004 | 530 | 15% |
| 5 | Kent | South East England | 3,478 | 3,105 | 364 | 10% |
| 6 | Lancashire | North West England | 3,301 | 2,484 | 792 | 24% |
| 7 | Oxfordshire | South East England | 3,245 | 2,225 | 985 | 31% |
| 8 | Glasgow | Scotland | 3,059 | 2,444 | 601 | 20% |
| 9 | Cheshire East | North West England | 2,980 | 2,110 | 787 | 27% |
| 10 | West Sussex | South East England | 2,845 | 2,034 | 783 | 28% |
Here’s a look at how the top ten positions look when FillThatHole.org.uk’s league table is ranked based on open reports though:
| Position | Authority | Region | Open reports | Total reports | Fixed reports | Percentage fixed |
| 1 | Surrey | South East England | 6,473 | 7,657 | 1,149 | 15% |
| 2 | Hampshire | South East England | 3,241 | 4,133 | 849 | 21% |
| 3 | Kent | South East England | 3,105 | 3,479 | 364 | 10% |
| 4 | Hertfordshire | South East England | 3,004 | 3,557 | 530 | 15% |
| 5 | Essex | South East England | 2,912 | 3,804 | 878 | 23% |
| 6 | Lancashire | North West England | 2,484 | 3,301 | 792 | 24% |
| 7 | Glasgow | Scotland | 2,444 | 3,059 | 601 | 20% |
| 8 | Buckinghamshire | South East England | 2,399 | 2,754 | 343 | 13% |
| 9 | Oxfordshire | South East England | 2,225 | 3,245 | 985 | 31% |
| 10 | Devon | South West England | 2,114 | 2,519 | 385 | 15% |
How frequently are potholes being filled?
The average number of potholes that were filled in 2016/17 per local authority throughout England worked out at 13,468, if the Asphalt Industry Alliance’s Annual Local Authority Road Maintenance Survey 2017 is anything to go by.
FillThatHole.org.uk has also ranked the top ten authorities based on fixed reports. Their league table regarding this topic looks like this:
| Position | Authority | Region | Fixed reports | Total reports | Open reports | Percentage fixed |
| 1 | York | Yorkshire & Humber | 1,187 | 1,341 | 151 | 89% |
| 2 | Surrey | South East England | 1,149 | 7,657 | 6,473 | 15% |
| 3 | Bristol | South West England | 1,094 | 1,475 | 199 | 85% |
| 4 | Oxfordshire | South East England | 985 | 3,245 | 2,225 | 31% |
| 5 | Cheshire West & Chester | North West England | 913 | 1,252 | 30 | 97% |
| 6 | Essex | South East England | 878 | 3,804 | 2,912 | 23% |
| 7 | Northumberland | North East England | 869 | 1,123 | 5 | 99% |
| 8 | Hampshire | South East England | 849 | 4,133 | 3,241 | 21% |
| 9 | Islington | London | 825 | 985 | 0 | 100% |
| 10 | Lancashire | North West England | 792 | 3,301 | 2,484 | 24% |
How many drivers reported damage in the past 12 months (ranked by region)*?
| Region | Number of drivers |
| South East England | 941k |
| London | 733k |
| South West England | 721k |
| Yorkshire & Humber | 720k |
| North West England | 687k |
| West Midlands | 609k |
| Scotland | 521k |
| Eastern England | 457k |
| East Midlands | 365k |
| North East England | 343k |
| Wales | 201k |
What was the average cost to repair pothole damage (ranked by region)*?
| Region | Average cost |
| Eastern England | £163.68 |
| South East England | £124.93 |
| London | £124.65 |
| Yorkshire & Humber | £120.00 |
| South West England | £119.01 |
| Scotland | £109.02 |
| West Midlands | £87.59 |
| North West England | £87.01 |
| East Midlands | £86.33 |
| North East England | £72.66 |
| Wales | £61.83 |
What is the structural road condition percentage split across England?
- Percentage of roads across England in good condition (i.e. they have 15 years or more residual life remaining) — 53 per cent.
- Percentage of roads across England in adequate condition (i.e. they have between five and 15 years’ residual life remaining) — 30 per cent.
- Percentage of roads across England in poor condition (i.e. they have less than five years’ residual life remaining) — 17 per cent.
Sources:
https://www.rac.co.uk/drive/news/motoring-news/pothole-related-breakdowns-up-despite-mild-weather/
*RAC data reported on at https://www.telegraph.co.uk/news/2017/05/15/pothole-damage-cars-soars-two-thirds-despite-dry-mild-winter/
https://www.asphaltuk.org/wp-content/uploads/ALARM-2017.pdf
https://www.fillthathole.org.uk/league-table?sort=desc&order=Total+Reports